Jul 16, 2020
Marketing analytics: what it really is, why you should care, and how to get better at it
23-MINUTE READ | By Pinja Virtanen
[ Updated Feb 17, 2023 ]
“Half the money I spend on advertising is wasted; the trouble is I don’t know which half.”
While John Wanamaker has been credited with spitting out these words in the late 1800s, he may as well have said them yesterday.
Why? Because 100+ years later the collective marketing industry still hasn’t quite figured out how to track and optimize their performance with data.
In fact, as of 2019, only 36% of marketers have quantitative tools for demonstrating the impact of marketing spend on company performance.
And while everyone’s talking about data-driven marketing, there’s a surprising lack of resources explaining how to get started with the exact kind of marketing analytics that might eventually help you identify which half of your marketing budget is wasted.
Well, until now, that is. Because we’re about to put an end to the crippling confusion that surrounds marketing analytics in the 2020s.
After investing ~25 minutes into reading this piece, you’ll be able to:
1. Clearly explain what marketing analytics means
3. Provide practical examples of what you can achieve with marketing analytics
5. Understand the process you need to master to get useful insights out of your data
6. Help your team (or yourself) level up in marketing analytics with a bunch of useful resources
Ready? Thought so.
1. What is marketing analytics, really?
Marketing analytics is the process of identifying meaningful patterns in data to inform marketing decisions.
In simpler terms, marketing analytics helps you make data-informed decisions to optimize your marketing spend on activities with the highest impact.
Breaking this down one step further, marketing analytics can be seen as:
- A sub-discipline of business analytics (i.e. the process of identifying meaningful patterns in data to inform business decisions)
- An overlapping discipline with financial analytics, sales analytics, product/service analytics, and customer analytics
- A key decision-making tool for answering strategic marketing questions, such as:
- Which audience segment(s) should we target?
- Which marketing channels should we use (to reach each segment)?
- What messaging, creatives, and copy should we use (to convince each segment to buy from us)?
- How much money are we currently spending on acquiring new customers? And how much money can we afford to spend on acquiring new customers?
- What’s our return on marketing investment across different channels?
2. Why should your company start investing in marketing analytics now?
While the simple answer to this question is, of course, that marketing analytics will help you make better decisions which in turn will help you drive more revenue for the business, we’re not going to stop there.
To sell the need for marketing analytics to your boss or board that now is the right time, you’ll need three kinds of data:
A) The business benefits of using marketing analytics
The very thing you’ll want to open with are the quantifiable business benefits of investing in marketing analytics.
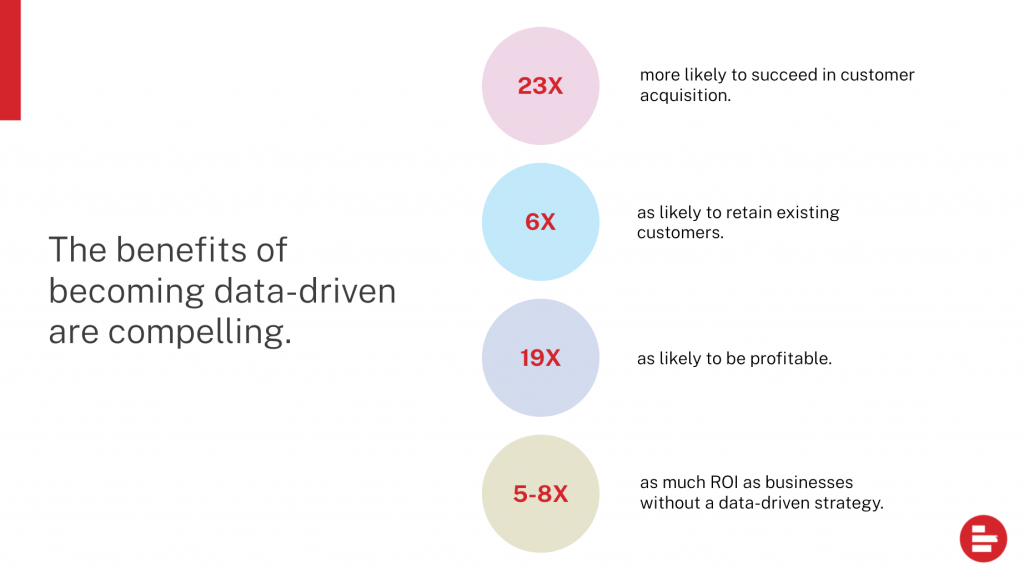
According to a recent study by McKinsey, data-driven companies are:
- 23 times more likely to succeed in customer acquisition
- 6 times as likely to retain their existing customers
- 19 times as likely to be profitable
Additionally, a different study from Invesp found that on average, data-driven companies across industries get 5-8 times the ROI of businesses without a data-driven strategy.
Pretty effective, right?
B) A self-assessment of your current marketing analytics maturity
Now that your stakeholders understand what the benefits of becoming data-driven are, you’ll want to explain your current state and aspirations in as simple terms as possible.
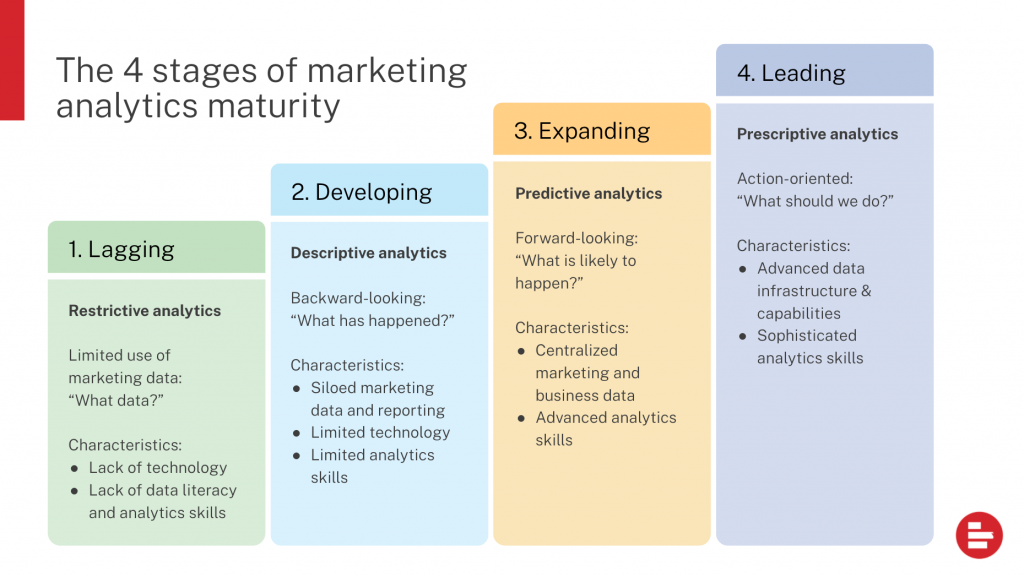
Using this 4-stage maturity model, you’ll be able to easily identify your current marketing analytics maturity level:
- Lagging: Characterized by “restrictive analytics”, a lack of analytics skills, and a lack of relevant technology
- Developing: Characterized by descriptive analytics, siloed marketing data, and limited technology
- Expanding: Characterized by predictive analytics and centralized marketing & business data
- Leading: Characterized by prescriptive analytics and advanced data infrastructure & capabilities
Let’s say that your current marketing analytics capabilities placed you on stage 2: developing.
By showing this image to your stakeholders you’ll help them understand how far away you still are from your desired state — whether that’s expanding or leading.
C) Quantifiable proof that now is the right time to get started
Even if your stakeholders theoretically understand the importance of your marketing analytics pitch, that doesn’t mean they’ll be ready to invest in it immediately.
That’s why your third task is to convince them that now is the right time to act.
The first thing you’ll want to do is be realistic about the analytics maturity of your competitors.
Similarly, up to 66% of companies rank themselves at an intermediate level or lower in Gartner’s Data-Driven Marketing Maturity Model.
However, according to Invesp, 40% of companies are planning to increase their data-driven marketing budgets in the near future. This means that early movers will reap the benefits mentioned in part 1 of this section.
Now it’s up to your stakeholders to decide whether they want the company to be among the first movers or the laggards.
3. Common applications of marketing analytics: aka why should you care?
Before we hand you the keys to the castle (i.e. explain the kind of moves you need to make to advance in marketing analytics), let’s take a quick look at some popular ways in which data-driven companies are benefiting from marketing analytics.
Measuring customer acquisition cost (CAC) and return on marketing investment (ROI)
Let’s rewind back to Wanamaker’s (supposed) quote for a minute. Because maybe the single greatest reason why you should absolutely care about marketing analytics is that it’ll help you prove the value of marketing.
This is mainly done in two ways:
- By proving that the average cost of acquiring new customers is low enough (typically compared to the average cost of serving those customers)
- By proving that marketing is bringing in more money than it’s costing (typically including both labor and media costs)
Attribution modeling
Attribution modeling is the process of assigning credit to the individual touchpoints that your customers have gone through before they converted.
Whether you want to attribute all the credit to the first or last touchpoint (which is called single-touch attribution) or assign credit evenly or unevenly between multiple touchpoints (which is known as multi-touch attribution), marketing analytics will help you analyze and understand the (digital) journeys your customers take before they become customers.
Resource allocation & prioritization
Additionally, marketing analytics is a great place to start if you need to build out a marketing strategy or decide which roles to hire for next.
Instead of saying “we have too much work for a single content marketing manager”, marketing analytics will help you say: “We could double our content-generated revenue which is currently $XX if we added another full-time content marketer to the team.”
It’ll also help you compare alternative marketing tactics when you have limited resources. Instead of saying: “I think campaign A sounds better”, you can go with: “Let’s go with campaign A because it’s similar to campaign Z which we ran last October and which performed really well.”
Campaign optimization
Marketing analytics will help you understand which marketing and advertising channels and what types of tactics bring in the highest returns. This will help you double down on the activities that are working — and write off the ones that aren’t.
For example, by analyzing the results of your split tests on Facebook Ads, you’ll be able to identify the messaging, creative, and copy variants that work best with a cold audience. By switching your ad variants to the highest performing variants, you’ll be able to improve your conversion rate — and eventually Facebook Ads-generated revenue.
Predictive marketing analytics
Okay, I admit that calling predictive analytics a common application in marketing might still be pushing it. But whether you’re ready or not, predictive marketing analytics is already spreading across more data mature businesses.
In practice, its applications range from segmentation to personalized content recommendations and everything in between.
But since leading B2C and B2B companies are already taking serious stabs at predictive modeling, it might already make sense for someone in your team to start looking into the many ways in which you can benefit from predictive analytics in marketing.
4. The 5 key ingredients of marketing analytics
Let’s pretend that your management team and/or the board of directors have given you the green light to start ramping up the company’s marketing analytics capabilities.
And now, you’re super excited to get down to attribution modeling and proving your ROI.
But how do you get started?
The way we see it, there are five key elements involved when you’re looking to improve your marketing analytics capabilities:
- Culture
- Skills
- Team structure
- Data
- Technology
Now let’s quickly look at each of these in turn.
1. Culture
The very first thing you’ll want to influence is the culture around marketing analytics and the way your marketing team uses data.
While there is no one right one way to do this, your goals here are to:
- Share your vision: help everyone in the team understand the practical benefits of leveling up in marketing analytics
- Convince everyone in the marketing team that they should be using more data in their day-to-day work and decision-making
- Lead by example by explaining what data you’ve used to make each decision
- Reward the team members who are working to improve their marketing analytics skills and/or who are able to demonstrate their use of marketing data in a clear and meaningful way
- Train your team on the necessary areas of marketing analytics and/or encourage them to learn more on their own (more on this later)
But speaking of employee training and development, let’s look at the skills you’ll want to develop in the team.
2. Skills
As soon as you’ve planted the seeds of cultural change in the team, it’s time to start mapping out the skills you need to develop — either by training existing team members, getting help from elsewhere in the organization, or hiring new people.
Realistically speaking, it doesn’t usually make sense to teach advanced data analytics to everyone in the marketing team. After all, most of their time should be spent on doing the kinds of marketing activities that drive the numbers.
That’s why you’re better off teaching everyone the basics that help them do their jobs better — and leaving the hard-core data crunching and analytics work to a certain team member or a full-time analyst.
A useful framework for skills mapping is to split the needed skills into three buckets:
- What everyone in the marketing team should know
- What only selected people in the marketing team should know
- What only someone in the organization should know
For the sake of the example, let’s apply this example to Supermetrics’ 5-person product & content marketing team.
- What everyone in the product & content marketing team should know:
- How to formulate good research questions
- How to track the performance of their own marketing activities
- How to report on the results of their own activities to stakeholders
- How to effectively visualize data when reporting to stakeholders
- Where to find the data they need to answer those questions
- How to perform basic ad hoc analysis to answer simple questions
- What selected people in the marketing team should know:
- How to perform advanced data analysis to answer complex questions about specific marketing activities
- How to report on the results of the whole product & content marketing team
- What only someone in the organization should know:
- How to perform advanced data analysis to answer complex questions about the business
For example, as the content marketing manager, I need to be able to analyze and report on the performance of Supermetrics’ blog — in terms of traffic and trials.
But when I want to do something more complex like build an attribution model to track the trials and customers that have been influenced by different blog posts, I’m encouraged to talk to our growth team, who’ll then help me set up the kind of tracking and reporting I need.
3. Structure
Speaking of asking other teams for help, let’s take a look at the three alternatives you have for structuring the analytics team.
A) A decentralized model
In a decentralized model, there would be a dedicated marketing data analyst or a team of dedicated marketing data analysts who report to the marketing lead and only work with marketing data.
B) A centralized model
In a centralized model, one team of data analysts would be responsible for serving the entire organization, from sales and marketing to product and finance. The downside of this approach is that different analysts will have varying levels of marketing understanding, which might slow the process down.
C) A hybrid model
In a hybrid model, the marketing team would have one or more dedicated analysts who report not only to the marketing lead but also to the head of data/analytics.
While there are a lot of arguments out there as to which of these structures is best, I’m going to leave you to choose the one that works best with your resources, needs, and business model.
And when it comes to the process you use to get the marketing insights you need, you’ll need to develop yours based on the team structure.
If, for example, you have a dedicated marketing analyst in your team, it makes sense for them to join team meetings to plan and prioritize their work just like any other team member would.
If, on the other hand, you end up going with a centralized model where there are no dedicated marketing analysts, you’ll need to work with the analytics team to come up with a process that works for both parties.
But more on the actual marketing analytics process a little later.
4. Data
Now that you have a clear structure and process in place, it’s time to start looking into the types of data you’ll want to analyze.
Depending on your business, choose the types of data that are relevant to your analysis:
- Customer data from your CRM (like Salesforce or HubSpot) and/or customer data platform (like Exponea or Segment)
- Web analytics data (from a tool like Google Analytics or Adobe Analytics)
- Transactional sales data from your ecommerce platform (like Shopify or Magento)
- Campaign data from your marketing automation or email platform (like Mailchimp or HubSpot)
- Advertising data from your paid channels (like Google Ads, Facebook Ads, LinkedIn Ads, Outbrain, Taboola, and/or Snapchat)
- SEO data (from tools like Google Search Console, Ahrefs, Semrush, and/or Moz)
- Organic social media data (from channels like Facebook, Instagram, LinkedIn, and/or TikTok)
5. Technology
Now that you understand the various data sources and types of data you’ll want to include in your analysis, it’s time to choose the technologies that will help your team get the job done.
The first category of technology you’ll need consists of your data destinations, aka the tools, platforms, and software your team will use to store, analyze, visualize, and report on data.
Possible data destinations include:
- A cloud-based data warehouse (like Google BigQuery, Snowflake, or Redshift) for storing your historical, cross-channel marketing, sales, and business data.
- A business intelligence tool like Tableau, Qlik, or Power BI where your analysts can crunch the numbers and visualize your data.
- A simple data visualization tool like Google Data Studio that everyone in the marketing team can use to create interactive dashboards.
- A spreadsheet tool like Google Sheets or Excel, where anyone regardless of their technical knowledge can perform basic data analysis.
The second category consists of middleware that’ll help you move the data types we listed before to the destinations you’ve chosen from the list above.
- A built-in marketing data connector for Excel, Google Sheets, or Google Data Studio that allows you to bring data directly into the destination you’ve chosen without ever leaving your spreadsheet or dashboard.
- A marketing data extraction tool (like Supermetrics API) that helps your data team extract marketing data as JSON which can then be fed into your BI tool or custom data solution.
- A marketing data pipeline (like Supermetrics for BigQuery) that allows you to automate the data transfers from your marketing platforms into your data warehouse.
Psst! If you’d like to give any of these tools a go, you can start your free trial today.
While technological decisions like these are never easy to make, once you’re done with the process of comparing alternatives and setting up a tailored data infrastructure, you’re well on your way to reaping the benefits of marketing analytics.
Next up, let’s look at the basic marketing analytics process you should follow once you have the right foundations in place.
5. The marketing analytics process
Whether you want to create your first predictive analytics model for lead scoring or simply conduct some descriptive (that’s a fancy word for backward-looking) analysis on why campaign A performed better than campaign B, you can follow this simple 4-step process to find the answers you need.
Step 1: Formulate a reasonable research question
Instead of diving headfirst into your data and swimming in circles trying to find some “insights”, you’ll want to start with a question.
To keep this fairly light, let’s go with the simpler of the two examples from above: Why did campaign A outperform campaign B?
More specifically, let’s say you organized two webinars with the same speaker and the same exact content. The first webinar resulted in 532 registrations and the second one only in 110.
For this comparison to make sense, the following prerequisites need to be met:
- The two campaigns were targeting the same audience (because you can’t compare campaigns that target different audiences)
- The two campaigns shared a similar goal (because you can’t compare webinar registrations with ebook downloads or trial signups)
- The two campaigns had the same budget (because it’s pretty likely that the one with more promotion budget would have outperformed the other)
- The same promotion channels and tactics were used to promote both webinars (because it’s pretty likely that the promotion channels and tactics used would’ve influence the results)
Now if you already noticed that some of the prerequisites weren’t met, you might be one step closer to understanding why the other campaign worked better.
If the prerequisites are met and you’re still no wiser, you’re ready to move on to the next step.
Step 2: Gather all the data you need to answer the question
Next up, you’ll want to collect all the data that might be useful in answering your research question.
In this case:
- A list of webinar registrations
- By source (e.g. email, organic social media, paid social etc.)
- By registration date
- By country / geographic region
- etc.
- External or 3rd party data
- The weekday on which you organized the two webinars
- National holidays in the target countries around the time of the two webinars
- Weather in the target countries around the time of the two webinars
- etc.
Once you’ve collected all the possible data points that could have impacted your second campaign’s poor performance, it’s time to get to the fun part.
Step 3: Analyze the data
Now let’s say that you analyze the correlations between the different data points and notice that your first webinar was organized on Friday, May 15th, while your second webinar was on Friday, July 3rd.
Coincidentally almost 400 people who signed up for the first webinar were based in the States, while only 3 people from the US signed up for the second webinar.
By looking at the US holiday calendar, you’ll probably notice something interesting.
When the US Independence Day, 4th of July, lands on a weekend, July 3rd is a day off instead.
You now have a pretty good idea for why your first webinar outperformed the second one.
Step 4: Learn and take action
Since you don’t want to analyze data just for the sake of analyzing data, the last step in the analytics process comes down to documenting the learnings and applying them.
In the simple webinar example, your main learning is, of course: don’t organize a webinar on a national holiday of any of your target markets. Duh.
It’s also typical to arrive at more inconclusive findings like “the hypothesis is that webinar A outperformed webinar B because A was organized on a Tuesday rather than a Friday.”
Or “the hypothesis is that trials dropped last week because a certain email drip campaign was turned off by accident.”
While you can’t do much to mitigate the effect of those external variables, you can compare your performance against historical data to validate your findings and adjust your goals if necessary.
The reason why I’m giving these ridiculously simple examples is that some basic reasoning skills are necessary for interpreting data.
Most of us don’t have to become hard-core analysts who can write SQL, R, and Python, but we do have to at least know which questions to ask from our analysts to get the kind of insights that will help us do our jobs better.
6. How to level up in marketing analytics
Okay, so you understand why marketing analytics matters, but you don’t know quite what to do to get better at it?
If you recognized yourself, this final part of the article is for you.
Start with self-reflection: what skills do you actually want to improve
The good news is that there are only three high-level areas of marketing analytics:
- The business side
- The data/analytics side
- The technical side
If you’re struggling to identify relevant questions to ask your analysts, it’s probably the business and/or marketing side you should brush up on.
If, on the other hand, you know exactly what you’re trying to achieve and you’re good at asking the right questions, but you want to know how to crunch numbers, report on your performance to stakeholders, or visualize the data on your own, it’s the data and analytics side you’ll want to learn more about.
And if you’re already proficient in both the business and the analytics side, but it would make sense for you to learn some technical skills like Excel formulas or SQL, well… then it’s obviously the technical side you’re looking to learn.
Bear in mind, though, that not everyone needs to master all three areas. For most marketers (whether you’re in SEO, paid acquisition, product marketing, or content marketing), understanding the business and knowing what kinds of insights you can glean from data is much more important than being able to perform advanced data analysis on your own.
With that said, if you’re looking to level up in data, analytics, or the technical side of marketing analytics, here are a bunch of awesome resources to get you started.
Choose the formats of learning that work for you
Now that you know what you’re trying to learn, let’s quickly list some marketer-friendly analytics resources in different formats:
Books and articles
Here are some of the analytics and data books we love here at Supermetrics:
- Analytics Best Practices, by Dr. Prashanth Southekal
- DataStory: Explain Data and Inspire Action Through Story, by Nancy Duarte
- Measuring the Digital World, by Gary Angel
- Storytelling with Data: A Data Visualization Guide for Business Professionals, by Cole Nussbaumer Knaflic
- Web Analytics 2.0, by Avinash Kaushik
And if you’re not a book person, here are a few shorter must-reads from around the internet:
- Marketing data warehousing: the ultimate guide, by Supermetrics
- Multi-channel attribution modelling: the good, bad, and ugly models, by Avinash Kaushik
- Predictive analytics in marketing: everything you need to know in 2020, by Supermetrics
- The ultimate guide to using Microsoft Excel, by HubSpot
- What is attribution modeling?, by Marketing Land
Podcasts
When it comes to (marketing) analytics podcasts, you should try:
- The Digital Analytics Power Hour, by Moe Kiss, Tim Wilson, and Michael Helbling
- The Present Beyond Measure Show, by Lea Pica
- Measure What Matters, by RightMetric
Online courses, on-demand webinars, and videos
Some paid courses that come highly recommended:
- Marketing Analytics, by Udemy
- Google Analytics for Beginners, by Udemy
- Web Analytics & Digital Marketing Analytics, by Udemy
- Excel & Google Sheets for Marketers, by CXL Institute
- Marketing Analytics Using R and Excel, by Udemy
- Data Analytics: SQL for Newbs, Beginners & Marketers, by Udemy
- Marketing Analytics Nanodegree, by Udacity
- Marketing Analytics, by Coursera & the University of Virginia
And some free webinars and videos if you’re not ready to commit to a paid course just yet:
- Excel for Marketers [YouTube playlist], by Tools by Tom
- How to build a marketing data warehouse using BigQuery and Supermetrics [Webinar], by Supermetrics & Better&Stronger
- How ebike company VanMoof supercharged their marketing reporting with a data warehouse [Webinar], by Supermetrics & VanMoof
Wrapping up
If you made it all the way down here, I believe you deserve some kind of a medal. ?
But as you might have noticed approximately halfway through the article, marketing analytics is a bit of a hairy beast. And that’s why a superficial account of attribution models simply wouldn’t have answered all the questions we run into when we talk to our customers about marketing analytics.
But for now, let’s wrap up with a quick TL;DR. To get started on leveling up your team’s marketing analytics skills, you’ll need to drive:
- Cultural change
- Bridging any possible skills gaps within the team
- Organizational change that makes analytics resources accessible to the marketing team
- Access to the right, high-quality data
- Technological adoption to help you move, centralize, and analyze the data
No easy feat, right?
All I can do now is to wish you good luck (and a lot of patience) on your journey!
And when you feel ready to tackle the data and technology part, your free trials of all Supermetrics products will be here waiting. ?
Turn your marketing data into opportunity
We streamline your marketing data so you can focus on the insights.